MXNet Sample
import pickle
import numpy as np
def cos_curve(x):
return 0.25 * np.sin(2 * x * np.pi + 0.5 * np.pi) + 0.5
np.random.seed(123)
samples = []
labels = []
sample_density = 50
for i in range(sample_density):
x1, x2 = np.random.random(2)
bound = cos\_curve(x1)

if bound - 0.1 < x2 <= bound + 0.1:
    continue
else:
    samples.append((x1, x2))

    if x2 > bound:
        labels.append(1)
    else:
        labels.append(0)
with open(‘data.pkl’, ‘wb’) as f:
pickle.dump((samples, labels), f)
import matplotlib.pyplot as plt
for i, sample in enumerate(samples):
plt.plot(sample[0], sample[1], ‘o’ if labels[i] else ‘^’,
mec=’r’ if labels[i] else ‘b’,
mfc=’none’,
markersize=10)
x1 = np.linspace(0, 1)
plt.plot(x1, cos_curve(x1), ‘k–’)
plt.show()
import numpy as np
import mxnet as mx
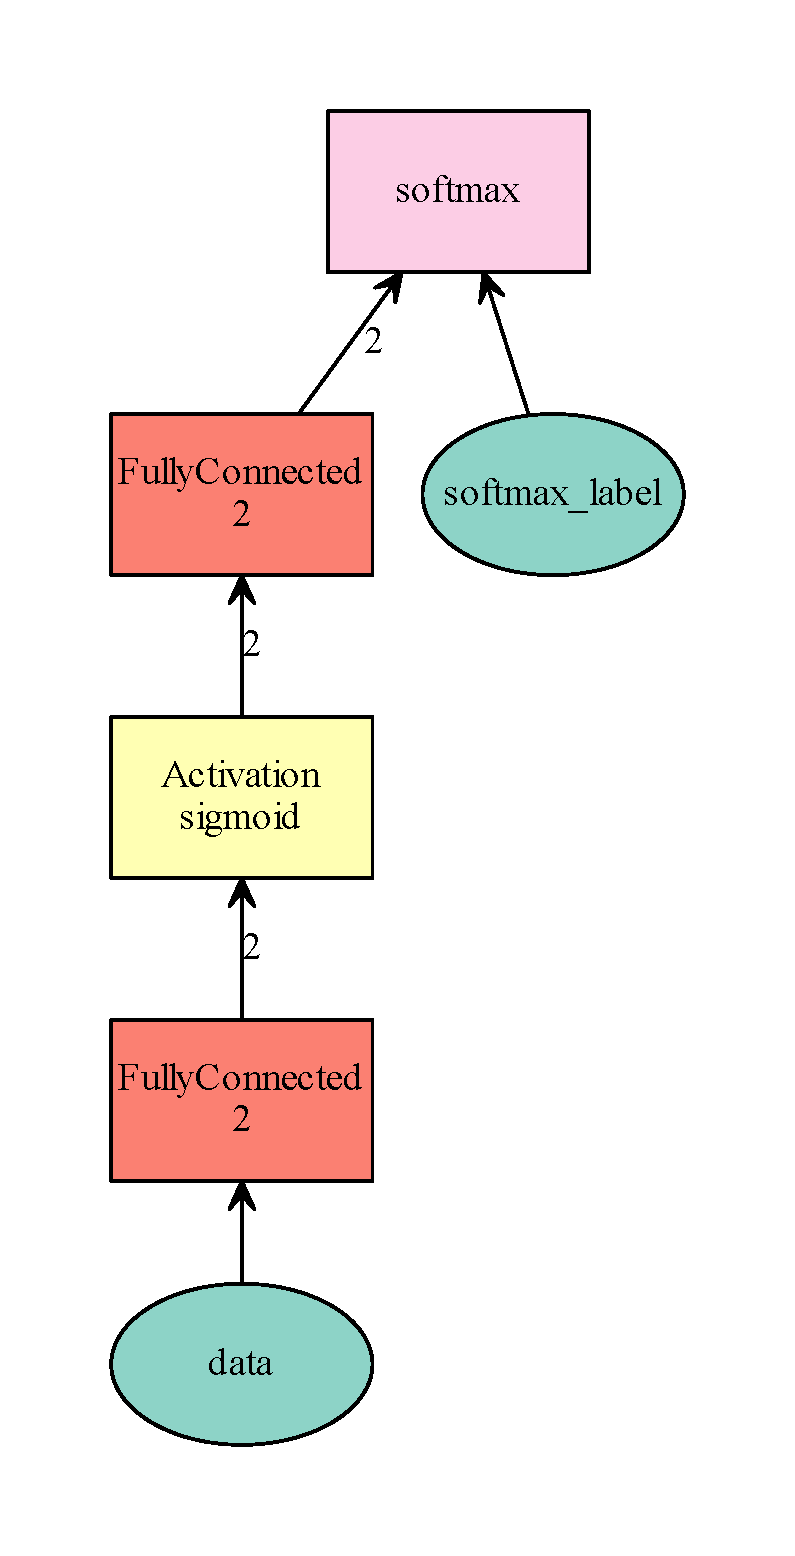
data = mx.sym.Variable(‘data’)
fc1 = mx.sym.FullyConnected(data=data, name=’fc1’, num_hidden=2)
sigmoid1 = mx.sym.Activation(data=fc1, name=’sigmoid1’, act_type=’sigmoid’)
fc2 = mx.sym.FullyConnected(data=sigmoid1, name=’fc2’, num_hidden=2)
mlp = mx.sym.SoftmaxOutput(data=fc2, name=’softmax’)
shape = {‘data’: (2,)}
mlp_dot = mx.viz.plot_network(symbol=mlp, shape=shape)
mlp_dot.render(‘simple_mlp.gv’, view=True)
import pickle
import logging
with open(‘data.pkl’, ‘rb’) as f:
samples, labels = pickle.load(f)
logging.getLogger().setLevel(logging.DEBUG)
batch_size = len(labels)
samples = np.array(samples)
labels = np.array(labels)
train_iter = mx.io.NDArrayIter(samples, labels, batch_size)
model = mx.model.FeedForward.create(
symbol=mlp,
X=train_iter,
num_epoch=1000,
learning_rate=0.1,
momentum=0.99
)
‘’’
model = mx.model.FeedForward(
symbol=mlp,
num_epoch=1000,
learning_rate=0.1
momentum=0.99
)
model.fit(X=train_iter)
‘’’
print(model.predict(mx.nd.array([[0.5, 0.5]])))
import matplotlib.pyplot as plt
from mpl_toolkits.mplot3d import Axes3D
X = np.arange(0, 1.05, 0.05)
Y = np.arange(0, 1.05, 0.05)
X, Y = np.meshgrid(X, Y)
grids = mx.nd.array([[X[i][j], Y[i][j]] for i in range(X.shape[0]) for j in range(X.shape[1])])
grid_probs = model.predict(grids)[:, 1].reshape(X.shape)
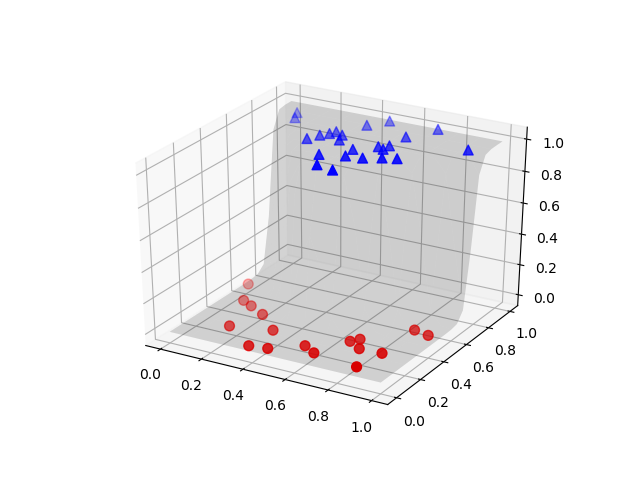
fig = plt.figure(‘Sample Surface’)
ax = fig.gca(projection=’3d’)
ax.plot_surface(X, Y, grid_probs, alpha=0.15, color=’k’, rstride=2, cstride=2, lw=0.5)
samples0 = samples[labels==0]
samples0_probs = model.predict(samples0)[:, 1]
samples1 = samples[labels==1]
samples1_probs = model.predict(samples1)[:, 1]
ax.scatter(samples0[:, 0], samples0[:, 1], samples0_probs, c=’r’, marker=’o’, s=50)
ax.scatter(samples1[:, 0], samples1[:, 1], samples1_probs, c=’b’, marker=’^’, s=50)
plt.show()