2D Example
import numpy as np
import matplotlib as mpl
import matplotlib.pyplot as plt
mpl.rcParams[‘xtick.labelsize’] = 24
mpl.rcParams[‘ytick.labelsize’] = 24
np.random.seed(42)
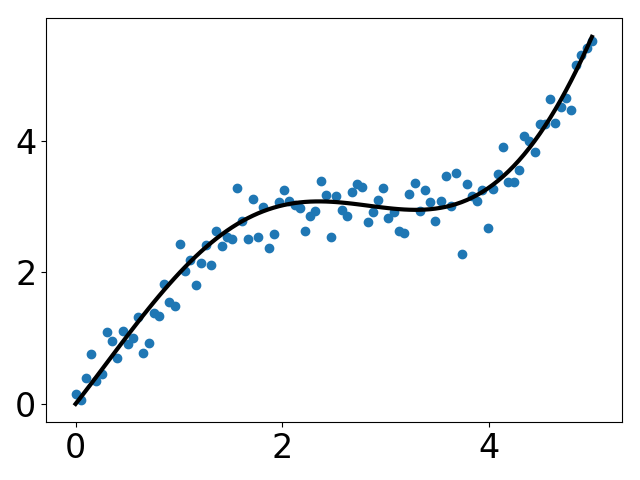
x = np.linspace(0, 5, 100)
y = 2 * np.sin(x) + 0.3 * x ** 2
y_data = y + np.random.normal(scale=0.3, size=100)
plt.figure(‘data’)
plt.plot(x, y_data, ‘.’)
plt.figure(‘model’)
plt.plot(x, y)
plt.figure(‘data & model’)
plt.plot(x, y, ‘k’, lw=3)
plt.scatter(x, y_data)
plt.savefig(‘result.png’)
plt.show()